Several types of plots are possible with Pine Script:
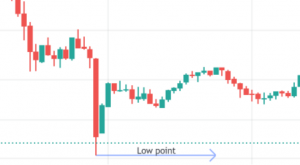
plot()–> as seen previously, allows you to plot a curvelabel.new()–> display a label/textplotshape()–> display a geometric shape (arrow, triangle, circle, etc.)line.new()–> draw a line/arrow, as shown below:
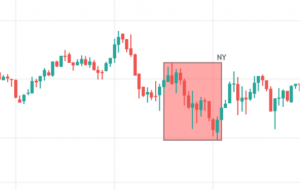
hline()–> horizontal line / levelbox.new()–> draw a box, as shown below:
Use the function .delete() to delete one of these objects.
There are limits to the number of these objects a script can reference and display on the chart. A single script instance can display up to 500 lines, and 500 boxes. You can specify the maximum number allowed for each type via the settings max_lines_count, max_labels_count and max_boxes_count of the declaration statement indicator() :
![]()
Note that an indicator must contain at least one call to these graphic functions (plot(), line.new(),…).
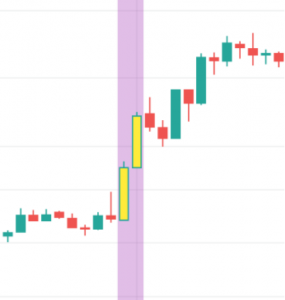
The function barcolor() allows you to color the candles of the chart and bgcolor() allows you to color the background. For example, we will color the bullish impulse candles and the background of these candles yellow:
![]()
with color.new(color.purple, 70) which indicates a purple color with 70% transparency, and offset=-1 which allows you to shift the display by one candle.
=>
Note: in these statements, the ternary operator ? : is used to create expressions of the form:
condition ? valueWhenConditionIsTrue : valueWhenConditionIsFalse
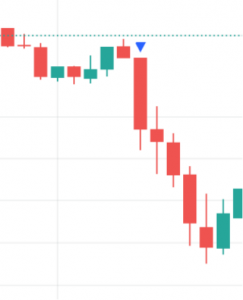
Another example, where triangles are displayed at the location of bearish impulses:
![]()
where shape.triangledown indicates a downward-pointing triangle shape and location.abovebar indicates that the shape is displayed above the candle.
=>
You can find here examples of drawing curves, lines and boxes with Pine Script:
https://www.tradingview.com/pine-script-docs/en/v5/concepts/Plots.html
https://www.tradingview.com/pine-script-docs/en/v5/concepts/Lines_and_boxes.html
https://www.tradingview.com/pine-script-docs/en/v5/concepts/Text_and_shapes.html