We will see in this part how to manage times and timestamps in Pine Script.
time corresponds to the Unix timestamp/time of the current candle (number of seconds passed since January 1, 1970). This value is independent of the time zone selected by the user on their graph.
We will take the example where we want to create a vertical line at the UTC+1 time of 00:00.
Here’s how to extract the UTC+1 hour/minute from the candle considered:
![]()
We will then create a Boolean variable named isMidnight which is worth 1 when the hour is 0 and the minute is 0; it is worth 0 otherwise:
![]()
If the condition isMidnight is satisfied, we then create a vertical dotted line of blue color and thickness 1 using line.new :
![]()
where bar_index indicates the index of the candle at which the script runs (on the first bar, bar_index is equal to 0 and it increases by 1 with each successive bar on which the script executes). xloc controls whether the x coordinates of the new row use candle indexes or time values.
=>
We can also obtain information about the timeframe. To obtain the timeframe used on the current graph in the form of string (text), we use the statement:
![]()
Timeframe strings have the following format: « 1S » (1 second), « 1 » (1 minute), « 60 » (1 hour), « 1D » (1 day), « 1W » (1 week), « 1M » (1 month),…
To now obtain the number of minutes included in each candle:
![]()
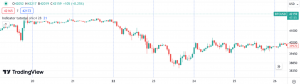
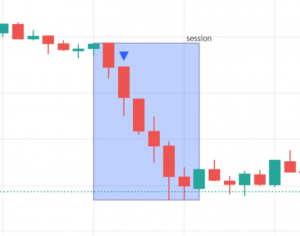
As a final example, we want to plot a box that corresponds to the times of the market session which takes place from 3 p.m. to 6:30 p.m. UTC+1 (Paris time).
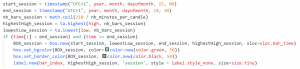
In this code, the meanings of variables and instructions are as follows:
start_session: session start time;end_session: session end time;nb_bars_session: number of candles in the session (the session lasts 210 minutes);highestHigh_session: highest price in session;lowestLow_session: lowest price in session;BOX_session: new box delimited by the opening/closing hours of the session, and the highest/lowest prices;box.set_bgcolor: change the color of the box (here blue color, transparency 70%);box.set_border_color: change the color of the border (here gray color, transparency 70%);label.new: add the label‘session’at the highest price level of the box and at the level of the current candle.
=>
Finally, the library barstate gives information about candles. For example, the function barstate.islast returns true if the script runs on the last candle of the chart; false otherwise.