Technical indicators can be computerized directly using the ta library under Pine Script.
To calculate the Moving Average (MA) on closing prices, we use the following instruction (for an MA10):
![]()
To plot this indicator with a red curve, we use the function plot:
![]()
=>
Plot of the Moving Average (MA) in red color
For the 14-period RSI:
![]()
To obtain the average, and upper/lower bands of the Bollinger Bands over 20 periods with a standard deviation of 1:
![]()
We may also want to calculate the high points on the last candles. Eg. here the calculation of the highest over the last 20 candles:
![]()
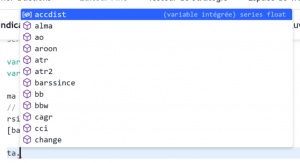
To obtain all the technical indicators available with the ta library, type ta. and the list of indicators will then be displayed (scroll with the up/down arrows on the keyboard):