To see what the structure of a Pine Script code is, you can already open existing scripts.
Click « Indicators » –> « Technicals » –> « Indicators » or « Strategies », and choose the indicator/strategy that you want.
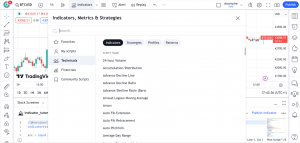
Once the indicator is open, you can see the source code (provided it is available). To do this, click on the braces {} (« Source code »), and the indicator code will open in Pine Script:
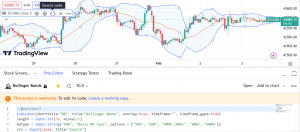
Observe the structure of the code.
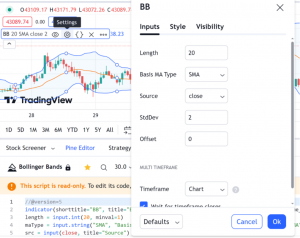
Here we have the Bollinger Bands indicator. The parameters of this indicator can be easily modified by clicking on « Settings »:
The objective of this tutorial will be to develop your own script, with a view to creating an indicator or strategy for Trading View.
A Pine script is not like the scripts of many programming languages. It runs once on each bar of the chart you are on, from left to right. Chart bars that are already closed when the script runs on them are called « history bars ». When the run reaches the last bar of the chart, it is on the « real-time bar ». Real-time bar updates when a price or volume change is detected.
The main data structure used in Pine Script is called time series. Time series contain a value for each bar the script runs on, so they continually expand as the script runs on multiple bars. Past values of the time series can be referenced using the historical referencing operator: []. close[1] eg. refers to the closing value on the bar preceding the one where the script runs.
Here you will find the code scripts used in this tutorial, for the indicator and for the strategy:
https://github.com/olivierrousselle/pine-script/tree/main
If you would like to know more about all of Pine Script’s commands, we invite you to consult the Pine Script v5 user manual:
https://www.tradingview.com/pine-script-docs/en/v5/index.html