Go to « Pine Editor ». To create a new indicator, go to « Open » –> « New indicator ». A new indicator then appears.
Note: to open an existing indicator code, go to « Open » –> « My script », then search for the name of the associated script.
Rename the indicator as desired, both in the title and in the code. Example if we call our indicator « indicator_tutorial »:
If you click « Save », this will both save the current code, compile it and check for any errors.
Let’s get to the code now.
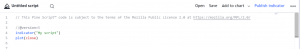
The symbol // allows you to indicate a comment.
In all Pine Script code, the Pine Script version to be used must be indicated at the beginning. We tell the compiler that we will use version 5 (the most recent version):
![]()
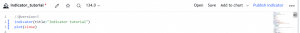
The following instruction indicates that we encode an indicator, the name of which is specified:
![]()
The statement
plot(close)
allows you to display the closing price on the screen (close).
The keywords open, high, low, close, volume allows you to directly have data on opening, highest, lowest, closing prices, and volume.
To plot the indicators on the screen, click on “Add to chart”. In our case, this displays the closing price (blue curve) in the data window:
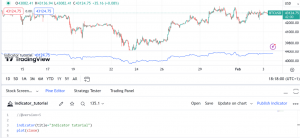
When a Pine script is loaded on a chart, it runs once on each historical bar using the OHLCV (open, high, low, close, volume) values available for each candle.
By adding overlay=true in the indicator declaration, we can plot our data directly in the main chart window rather than in the data window:
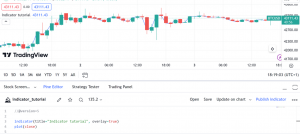
Note: on Trading View, you cannot display an indicator both on the main chart and in a separate chart.